📊 Performance Stats
An overlay display feature for real-time monitoring of game performance. Continuously displays FPS (frame rate) and various memory usage metrics to help identify performance bottlenecks early.
🛠️ Main Display Items
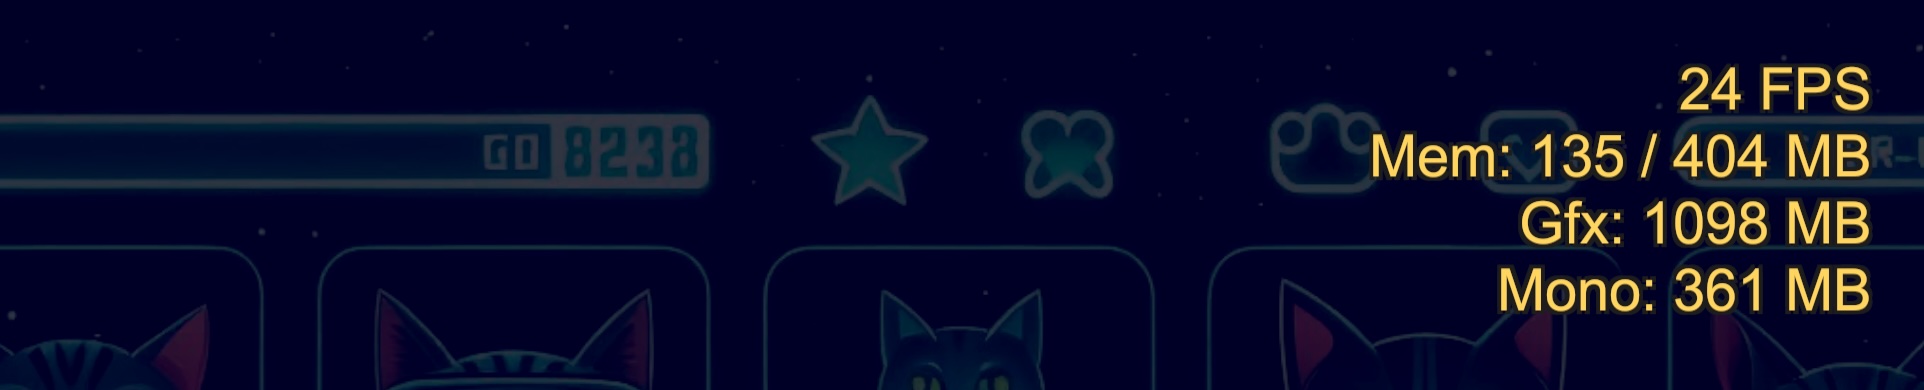
- FPS: Frame rate. Measures current processing speed
- Mem: Current total memory usage / device maximum memory
- Gfx: Graphics (VRAM) related memory usage
- Mono: C# (Managed) heap memory usage. Effective for tracking GC occurrence timing
🚀 Use Cases
Displays real-time load conditions (FPS, memory consumption) on screen, allowing instant numerical verification of any "lag" noticed during device testing.
Identifying Causes of Stuttering
- If Mono (Managed memory) increases sharply along with FPS drops, you can suspect GC (Garbage Collection) spikes.
Monitoring Graphics Load
- By tracking Gfx (GPU memory) values, you can detect signs of crashes due to excessive texture loading or VRAM shortages.
Early Detection of Memory Leaks
- If Mem (Total Allocated) doesn't decrease after repeated scene transitions, you can immediately identify potential leaks where references remain.
Collaboration with QA/Testers
- Simply having these values visible in bug report screenshots allows engineers to get a general idea before running the profiler.
🎨 Switching Display Modes
Choose between two display modes to suit your project's debugging needs.
| Mode | Features |
|---|---|
| Detailed | Displays all statistics in detail |
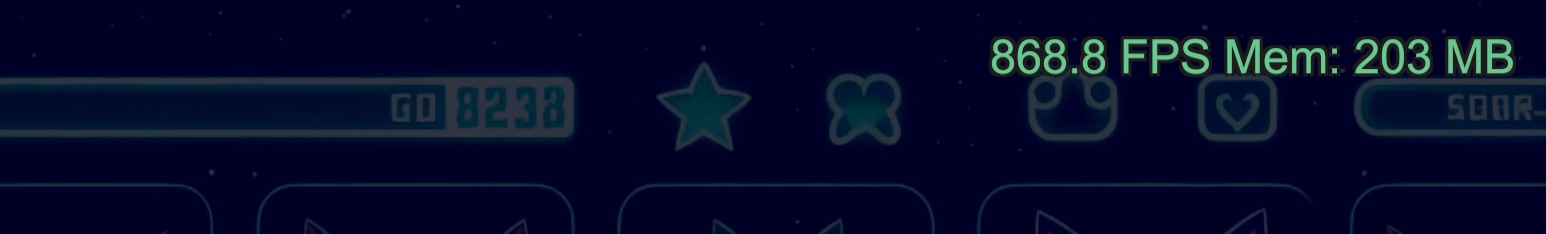
| Simple | Shows only FPS and main memory info compactly in one line |
- Detailed
- Simple
⚙️ Customization (Settings)
Fine-tuned adjustments can be made from Window > Logify-Unity > Settings to avoid interfering with your app's UI.
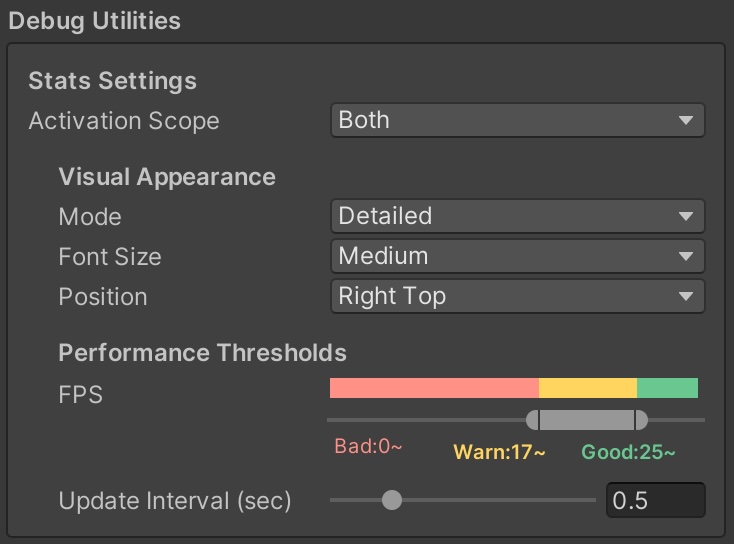
- Activation Scope: Choose to display only in Editor, only on device, or both.
Visual Appearance:
- Mode: Switch between Detailed / Simple
- Font Size: Adjust text size
- Position: Select display position from screen corners (Right Top / Left Bottom, etc.)
Performance Thresholds:
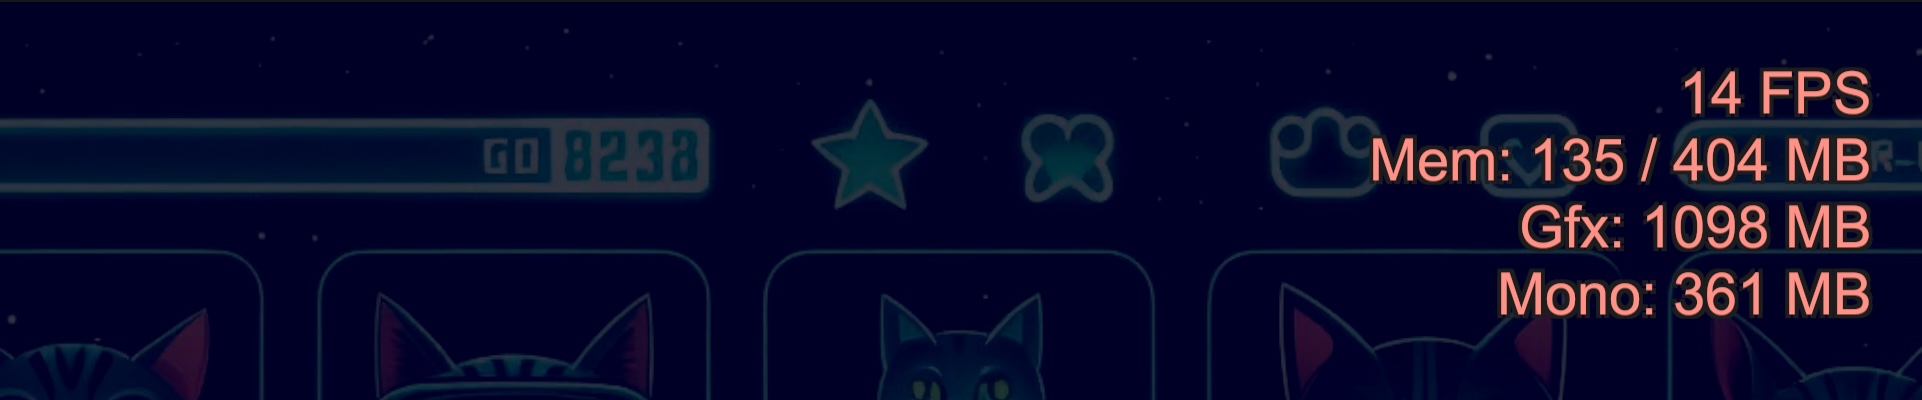
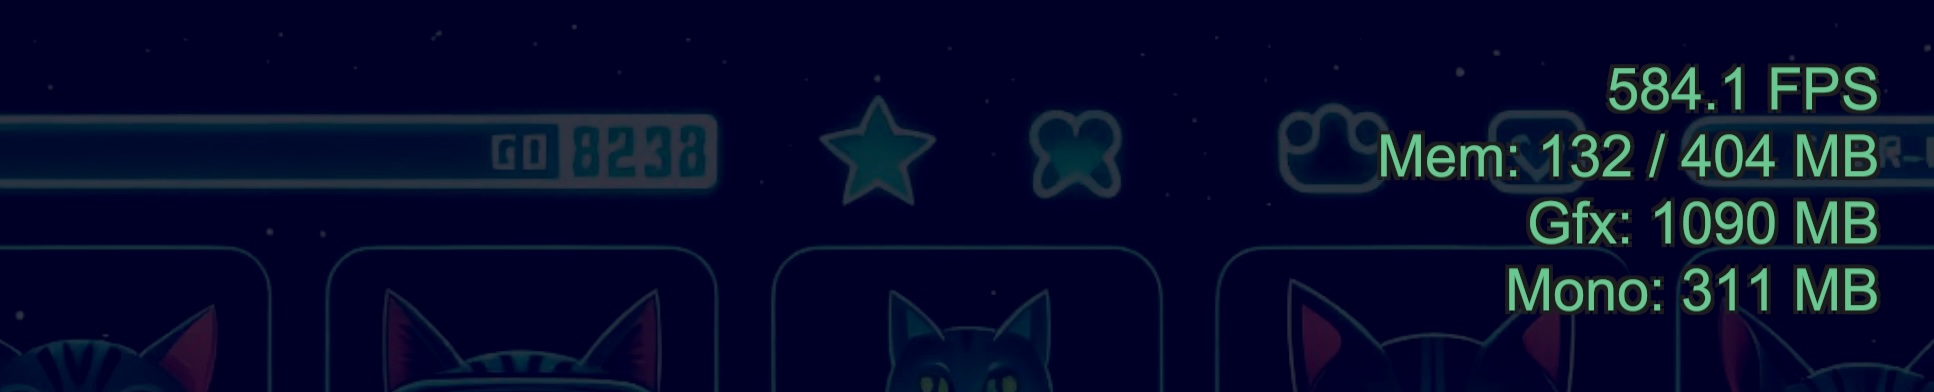
- Dynamically changes text color based on FPS values (e.g., yellow below 30 FPS)
- Thresholds can be intuitively customized with sliders
- Update Interval: Set update interval (seconds). Default is 0.5 seconds
- Good
- Warning
- Bad